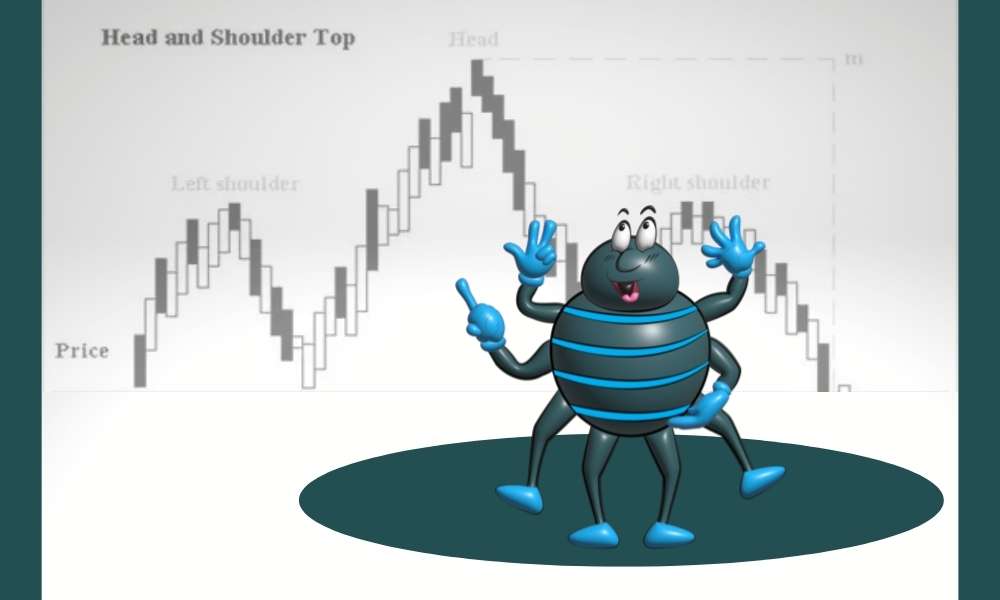
Technical analysis makes use of the head and shoulders pattern. A particular chart pattern demonstrates the transition from a bullish to a bearish trend. The pattern resembles a line with three peaks, the center peak being the tallest and two of the peaks being around the same height.
When a stock's price reaches its peak and then declines down to its starting point, a head and shoulders pattern is formed. The price then rises beyond the prior peak, creating the "head," before falling to the starting point.
The stock price then increases to a point that is about equal to the formation's first high before declining once more.
One of the best indicators of when a trend may change is the head and shoulders pattern. It is one of a select group of prominent patterns that suggests, in varying degrees, that a rising trend is going to come to an end.
There are four parts to a head and shoulders pattern:
The shoulders are the first and third peaks, and the head is the second peak. The boundary between the first and second troughs is known as the neckline.
The antithesis of a head and shoulders chart is an inverse shoulders head and shoulders chart, also known as a head and shoulders bottom. It is the reverse of a head-and-shoulders bottom, which indicates that a downtrend is about to change. When any of the following circumstances occur in relation to the price of a security, this pattern can be seen:
A turn around may occur, according to the head and shoulders pattern. Traders believe that three peaks and valleys, with a greater peak in the center, indicate that a stock's price will begin to decline. Traders that anticipate a decline in price start to sell at the neckline.
The pattern also indicates that unless the right shoulder is broken, which occurs when prices rise above the levels at the right peak, the new downward trend is likely to last.


